PA Election Analysis: HUGE Anomalies & Indisputable Data

Joe Biden had said that he would not concede the election until the states have certified the votes, yet he did just that. While the world holds its breath over election shenanigans, President Trump’s legal team is working overtime, filing suits, gathering affidavits, speaking with whistleblowers, calling voters who may not have voted, pulling obituaries, and exposing the voter fraud to the American people. Simultaneously, multiple people are also breaking down the statistics, data points, and revealing the patterns of election fraud, whereby likely millions of votes were flipped from Trump to Biden through a multi-layered combination of hardware, software, algorithms, and firmware generally known as the Hammer, Scorecard, Dominion and other transfer points.
The analysis below represents data points that Corey’s Digs
has been working on to show how this all adds up, how the probabilities are
impossible, and how the “anomalies” are actually equivalent to controlled demolition.
There were 18 of 67 counties in Pennsylvania, 10 democrat and 8 republican, utilized
to show the consistencies, patterns, and anomalies.
• Biden ran at nearly
a perfect 2.5 – 3.5% average increase from 2016 in 17 of 18 Pennsylvania counties
studied in this analysis, including all 8 red counties
• Current PA voter registration list as
of November 7th only accounts for 35% of actual reported votes, with
a consistent 46% to Biden and 17% to Trump across 18 counties, including
republican counties
• Biden received thousands
more votes than actual registered Democrats
• Pennsylvania eligible
registered voters is at 89.30%, with many counties over 94%, due to unmanaged,
and potentially rigged voter rolls
• 6 of the 18
counties show other Republican races on the same ticket running at a higher
percentage rate than Trump
• 2020 new Democrat
registration is too low to account for major vote increase
• Biden’s alleged votes
have surpassed Hillary Clinton, Barack Obama, Ronald Reagan, and every other
presidential candidate in US history
All data points were extracted on November 7, 2020. Whereas, there may be an increase in vote totals since then, it would not modify the patterns and findings already discovered in this analysis. All data was pulled from official Pennsylvania websites, Votes PA and electionreturns.pa.gov, as well as their voter registration list that was current as of November 7, 2020 at the time of export.
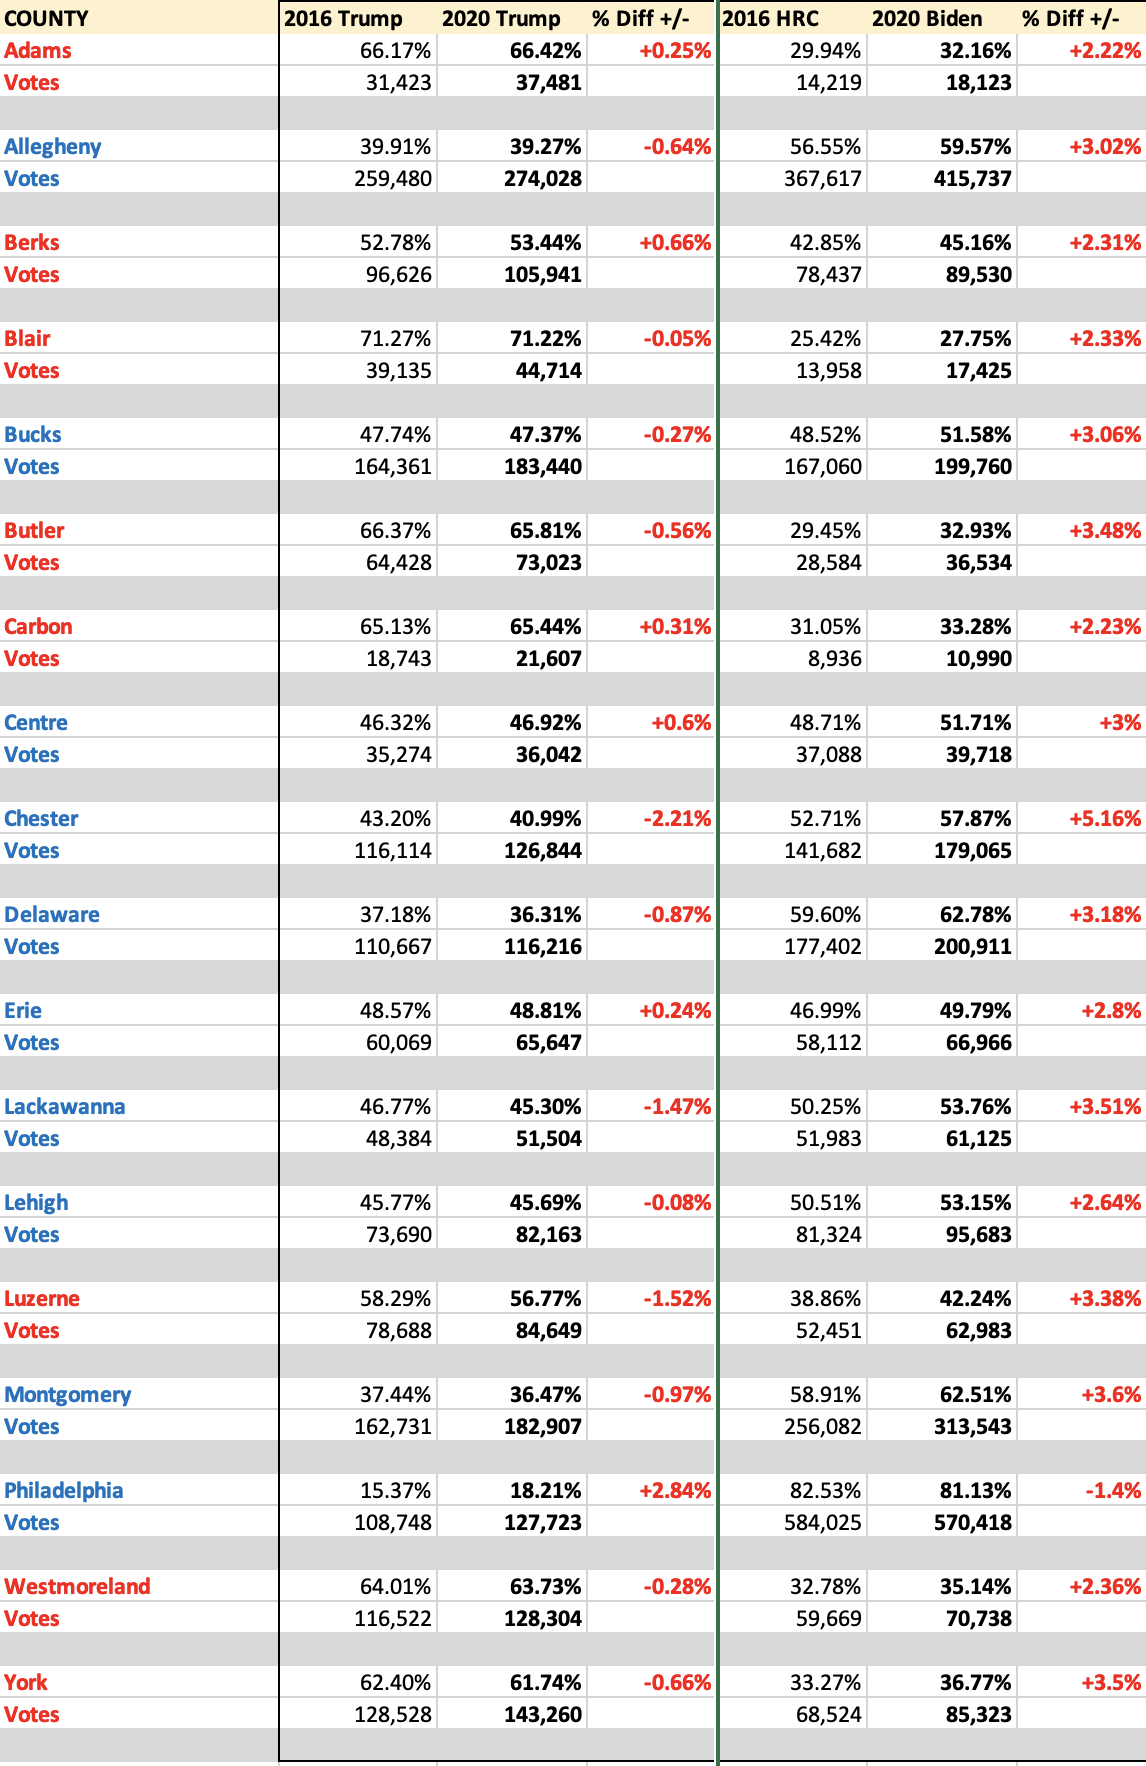
The Margins Between 2016 and 2020
The data below reflects President Trump’s votes and
percentage of votes by county in the 2016 election, alongside the 2020
election. Whereas actual votes increased in every county, the needle barely
moved because of the votes Biden received that offset the spread, and in 12
cases reduced Trump’s percentage in comparison to 2016. Similarly, to the right
of Trump’s chart, are Hillary Clinton’s votes/percentage from 2016, indicating
a large jump in Biden’s votes, accounting for a +2.5-3.5% increase on average,
in 17 of 18 counties, including every single Republican county. In Chester
County, there is a significant increase of +5.16%, and Montgomery County
increase by +3.6%, and there is good reason for that, as seen in the next set
of charts.
Biden Received Thousands of Votes Above Actual Registered Democrats
Take a look at Biden’s 2020 vote totals alongside the total
registered voters. In Chester County, he
received 179,065 votes, but there are only 157,346 registered Democrats, and
this is according to the State of Pennsylvania’s vote tallies and registration
list as of November 7, 2020. That’s a huge increase of 21,710 votes.
Montgomery County
received 313,543 votes for Biden, with only 301,779 registered Democrats.
Again, this is a very large increase of 11,764 votes.
Together, that makes up 33,474
mysterious votes, and it likely happened in other counties as well. It is
highly suspicious because it is unlikely that Republicans flipped or that there
are so many “non-affiliated” that would have voted for Biden. At the same time,
the registered “other” column boasts very large numbers for both counties. An
explanation for this may be found in the next chart after the one below.

In the Pennsylvania lawsuit filed by the Trump J. Trump For President, it states that “in Montgomery County, a poll watcher observed a Judge of Elections pull aside voters who were not listed in the poll books as registered to vote. The poll watcher reports hearing the Judge of Elections tell those voters that they needed to return later and report their name as another name that was in the poll book.”

Are they perhaps pulling names from the “other” party that
seems to be packed so well? In Delaware County, the PA voter registration list
indicates that there are 44,836 “Active” registered voters, yet their website
shows only 20,912. So which is it?

Delaware County reviewed by The Sharp Edge
Pennsylvania is
reporting there are only 8,332 registered “Other” voters in Lehigh County, yet
their registration list indicates that 8,535 people voted on November 3rd, and
they have only reported on 37.74% of the vote totals, so that number may have
increased quite a bit. That would mean 203 people voted who technically weren’t
registered to vote.

November 7th Registration List Only Reflects 35% of Actual Votes Being Reported and Counties Consistently Reported The Same Spread of 29% in Favor of Biden, Even in Republican Counties
Perhaps this set of numbers is the most intriguing, and possibly the most telling. The complete PA voter registration list is updated weekly on their site, indicating that records are current, and available for purchase and export. These numbers are extracted from the list obtained on November 7, 2020, so all votes tallied through that date should have been recorded as voted November 3rd under the “last vote” column, for those who voted. Pennsylvania did not start counting any of their votes until election day, not before. They separated out in-person vs mail-in ballots and reflect those counts on their website. Therefore, the total votes from Democrats and Republicans should include all votes tallied through November 7th. One would expect that a big chunk would be reflected here, and that the percentage of votes counted by county would likely vary quite a bit. Yet, Biden’s vote count sits at an average of 46% of the final vote counts, and what is so strangely bizarre is that nearly every single county is spot on with one another.
When reviewing the total votes under Republicans, it tells a
totally different story, whereby only an average of 17% of Trump’s votes were counted. In total, the average votes counted across 18 counties only reflect 35%
of the total votes being reported. How is this possible, especially in the
Republican counties where Trump won? Why would Biden have 47% of his votes
counted in Adams County, and Trump only have 17%? Even if the mail-in ballots
were counted before or after in-person votes, it does not explain this anomaly.
Why are all 18 counties consistent with one another? Was this a starting gauge
to work from?
In reviewing these percentages
as they stood on November 7th, it created an average 29% spread
between Biden and Trump, favoring Biden.

The chart
above reflects a question mark under the “Other” party column because we can’t
know for certain exactly where all of those votes went. But, we can break it
down to show several key data points. Let’s take Allegheny for example:

The total
number of voters on PA’s registration list who voted on November 3rd,
would be the total of Democrats, Republicans, and Other under column D. The
total votes reported on PA’s election website is reflected under column C.
Total votes on registration list: 331,899
Total votes on PA election site: 698,288
Registration
list only accounts for 47.53% of actual reported votes for Allegheny County
When we split
the percentage of votes accounted for on the registration list ONLY, as of
November 7th, which was at 331,899, it breaks out like this:
Democrats: 72.65%
Republicans: 17.52%
Other: 9.81%
Yet, when
comparing the number of “Other” votes accounted for on the registration list
against “Other” registered voters, it shows that 73.55% of those individuals’
voted and their votes were counted. That’s an interesting number, and seems to
be the case in most of the counties. This would suggest that those who fell
under the “Other” column had their votes accounted for first, then Democrats,
then Republicans OR something was being manipulated. To put it another way,
Republican counts are only averaging 17%, Democrats average 46%, and Other
average 73%. Since there are only 44,307 registered voters for the “Other” parties,
and 32,590 are accounted for as having voted, it would seem the majority (if
not all) of those counts were in.
The “other”
party accounts for 32,590 votes. In Allegheny County, 8,341 votes went to Jo
Jorgensen, leaving 24,249 votes dispersed between Biden and Trump. We can see
that Trump picked up 6,051 votes above registered Republicans, due to “Walk
Away” and some folks who probably listed themselves as non-affiliated. That
would mean that 18,198 votes would have gone to Biden from the “other” party,
which is highly unlikely.
The Spread
This column indicates the spread between Biden and Trump,
with either a positive or negative for Biden based on win/loss. The red
represents a county Trump won, so that would be a negative percentage to Biden.
Likewise, the blue represents a county that Biden won and reflects as a
positive percentage. What this shows is that in the 8 counties Trump won, the
average spread breaks down to 27.39%, whereas in the 10 counties Biden won, the
average spread breaks down to 17.84%. That’s quite a difference. Of course, to
get a better picture, running this math on all 67 counties would be key.

New Registered Voters Didn’t Swing The Election Biden’s Way
As anyone can see, at least in these significant 18
counties, new registered voters certainly didn’t swing the enormous amounts of
votes Biden’s way.

Even with Biden receiving 21,710 votes above and beyond
registered Democrats in Chester County, the mere 4,740 new registered voters
couldn’t have filled that gap.

Even with Biden receiving 11,764 votes above and beyond
registered Democrats in Montgomery County, the 7,362 new registered voters couldn’t
have filled that gap either.

Pie charts produced by Seamus Brunner
Voter Rolls Packed with Fluff Across The Country
One of the most eye-opening statistic is the alleged number
of registered voters in this country. They are chock full of everything from
dead people to people who haven’t voted since 1992, birthdays of 1/1/1800 or
1/1/1900, people who have moved out of state, people who have changed their
names, and duplicates. It is no mystery as to why the percentage is so high.
That said, there is a little trick they do to keep the voter
rolls padded. Anywhere one looks up the percentage of registered voters by
state, they will find a percentage based on the entire population of the state,
rather than eligible voters 18 years of age or above. This allows the
percentage rate to come down and appear more realistic.
One would not establish the percentage of 16-year-old females
attending a specific high school by including females AND males when deriving at
the percentage, yet they include those who are under the age of 18 when calculating
the registered voter percentage by population. Sneaky.
Given that, all states bump up quite a bit. In fact some
states even exceed 100% of their eligible population, such as Michigan at 103%.
In Pennsylvania, it puts them at 89.30%,
but when drilling down through counties those numbers rise drastically, and are
as high as 97.35% in Bucks County.
Pennsylvania Counties


Battleground States


The Steal
In conclusion, “the steal” would appear to be very real. The
astronomical amount of votes that were likely flipped from Trump to Biden is
staggering when factoring in all of the ground games that were played in
addition to the multi-layered
combination of hardware, software, algorithms, and firmware generally known as the
Hammer, Scorecard, Dominion and other transfer points. But make no
mistake, the bulk of the steal came from the latter.
If you live in Pennsylvania, you can check to see if your vote was in fact recorded, by checking the box in front of pa_voters > select data > search > select last_name and first_name fields and enter your name, then scroll to the right under “last_vote_date” and verify it says 2020-11-03. If not, be sure to screenshot the entire row containing your information. If you are located in Michigan, you can find the same table here.
An enormous amount of evidence and affidavits have already
been gathered and lawsuits are moving forward. Despite the media, Democrats,
and the entertainment industry putting on a theatrical Hollywood glamour movie
with Biden cast as the lead role, most of America is aware that this is far
from over and states still have to certify the votes.
No matter what party anyone is affiliated with, the entire
country should be outraged by the election system that is in place, the lack of
security, disregard for law, fraud being committed, and voter rolls that have
more fluff than a peanut butter and fluff sandwich on a Sunday afternoon.

The post PA Election Analysis: HUGE Anomalies & Indisputable Data appeared first on coreysdigs.com.