CDC Public Health Data Fudging 1: COVID-19 Rates Explained
James Lyons-Weiler, PhD
5/4/2020
THIS IS A COMPANION ARTICLE TO AN UPCOMING EPISODE OF THE PODCAST “UNBREAKING SCIENCE” IN WHICH DR. JACK EXPLAINS 1. WHICH RATES YOU NEED TO UNDERSTANDING TO DISCUSS THE COVID-19 PANDMIC, 2. WHY ESTIMATING DEATH RATES DURING AN OUTBREAK IS HAZARDOUS, 3. HOW TO NOT CONFUSE CASE FATALITY RATES AND POPULATION MORTALITY RATES, AND 4. HOW YOU CAN THINK ABOUT HOW YOU ARE THINKING ABOUT COVID-19 AND CONTRIBUTE TO THE CONVERSATION.
On 5/2/2020, CDC published the number of deaths from COVID as under 34,000. Surprised? You should be. By all accounts, the US has reported over 67,000 deaths – depending on who you read, confirmed deaths (e.g., The Weekly).
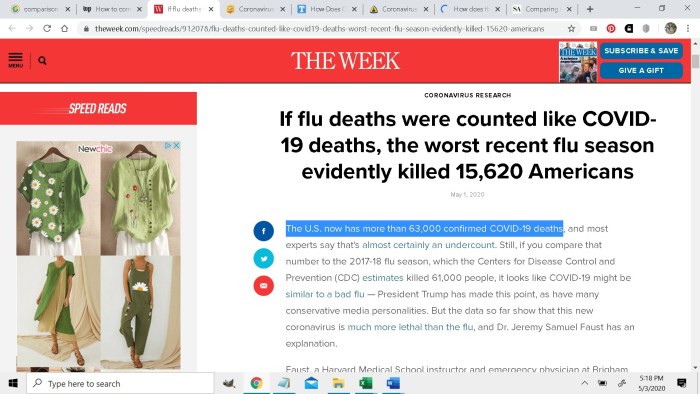
The point being, of course that when the public – and public health officials see “Number of Deaths” – they believe they are seeing confirmed deaths.
Johns Hopkins reports – without caveat = that the “Number of Deaths” in the US are currently over 67,000:

These are the statistics we have all been following.
Now here are the recently publicized statistics from CDC:
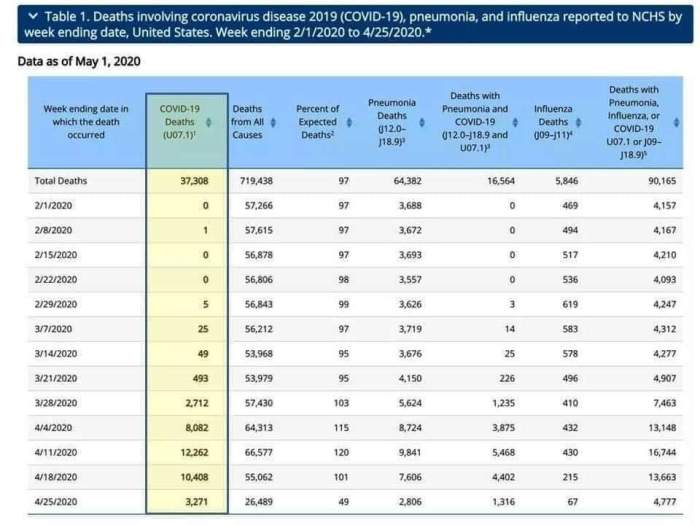
The first thing that pops out to me is the number of flu deaths is about double that of past seasons – if you follow my protocol for undoing CDC’s inflation protocol that adds pneumonia to flu deaths so influenza qualifies as an epidemic. Remember we are at the end of the flu season. With the few months’ reporting, the number of flu cases being this high is shocking because it is double that from past years for the entire season.
The second thing that sticks out to me is that a huge proportion of people – in fact most – w/COVID-19 at death must not involve pneumonia.
Of a total of 37,308 people who died with COVID-19, the table reports only 16,564 deaths “with Pneumonia + COVID19”
That’s only 44% of people who died with COVID-19 also had a diagnosis of pneumonia.
The third thing that sticks out of course is the difference between 37K and 67K deaths that we have all been tracking. This massive discrepancy between CDC’s 37K and the everywhere-else-reported 67K is due to the use of that set of statistics being based on confirmed COVID-19 cases and “suspected” COVID-19 cases. I’ve seen explanations attributing the discrepancy in the lower number – 37K – as being due to a “lag” in confirmation – in fact the 33K CDC source says precisely that. But that is no explanation for the difference. Why, and how, for example, does an estimate of 67K even exist? And how can other CDC sources such the
and places like Johns Hopkins, whom we can presume gets their data from CDC, have results two weeks ahead of… the CDC? Why are we being misled in our perception of risk by inflated death rates – at all?
A probable case or death is defined by CDC by fulfillment of one of the following: “Meeting clinical criteria AND epidemiologic evidence with no confirmatory laboratory testing performed for COVID-19; Meeting presumptive laboratory evidence AND either clinical criteria OR epidemiologic evidence; Meeting vital records criteria with no confirmatory laboratory testing performed for COVID19.”
That’s of little assurance given that policies have been founded on the 67K estimate – not the 33K confirmed cases. CDC’s paradigm – some would call it their M.O. – is to overestimate death rates from infectious disease – explicitly, as if that’s appropriate or even useful for a reason-based response.
We have been waiting to see how CDC would reconcile their shady practices on “Influenza” death reporting – outed in Scientific American as “wild overestimates” following my report of the discrepancy on LinkedIn given the impact of COVID-19 on influenza death rates – since the default for “flu-like symptoms” has become “suspected COVID-19” instead of “suspected influenza”.
When it comes to flu deaths reporting and COVID-19 ‘suspected’ cases taking an unfair share away from the annual faux “Influenza” aka “Influenza Disease” aka “Pneumonia & Influenza”, something had to – and still has to – give, if “Influenza” – however CDC will define it in June – is to qualify as an “epidemic”. Their efforts at correcting their oversight appears to have led to as many as four times more influenza cases than they need. Oops.
Data fudgery, statistical shamwizardy, some shift was expected – I predicted it a month ago, but expected a gradual drip leaning toward bias in the updates in June – because, put plainly, CDC does not track influenza cases with integrity. To learn exactly what I mean by that, and why you need to know how to think about rates, read on…
CDC Uses Scientism, but That Pits Belief in Sciency Things vs. Science
So much discussion these days online involve taking a “position on” or “believing” in something, and this is actually not very helpful when one is trying to understand an outbreak. While the public has every reason, the right and the responsibility to remain vigilently skeptical of anything coming from the CDC, it’s important that we are able to discuss and focus on numbers and rates without giving up in frustration and saying “I don’t know what to believe”. Situations change in outbreaks and pandemics, thus the actual values change (they are dynamic) from day to day and week to week in response to complex variables that impact growth. It’s best to think about values we discuss like the Stock Market.
While that makes these issues are complex, with a careful read of this article, and a follow-up viewing of the companion Unbreaking Science episode (link forthcoming), you’ll be able to quickly understand what you are looking at and be able to communicate your ideas and thoughts quickly and efficiently.
What Determines How Bad An Outbreak Will Be?
[Warning: Deep Dive into the Geek Arena Here, But You Will Learn]
During an outbreak, epidemic, or pandemic of a deadly disease from virus, people want to know the answer the following question: “How bad will this be?” This is determined in part by characteristics of the virus (transmissibility and virulence, see my article on these two), and the characteristics of the host species. This means it is largely determined by our ability to respond to the virus. The characteristics of the virus and how we respond to it determines the following outcome measures, all of which can change depending on how we respond:
(1) R0 (R-Naught). This is the number of people a person infected with SARS-CoV-2 (or any pathogen) may be expected to infect. People often think that R0 is a fixed characteristic of a virus. It is not. It is best to think of R0 as an outcome of all of the characteristics of a virus and a populations’ respond to the virus up to a given point in time, but it’s even better in my view to consider R0 on a daily basis during an outbreak.
I have a measure of an effective R0 that is easy to calculate Effective R0 (EffR0) for COVID-19, as the ratio of the number of COVID-19 cases today to the number of cases five days ago (given a 4-5 day asymptomatic period preceding diagnosis). This can be done for any town, county, state, country, or for the entire world.
Here is chart of EffR0 for the US from Day 1 of the first recognized case until 5/3/2020:
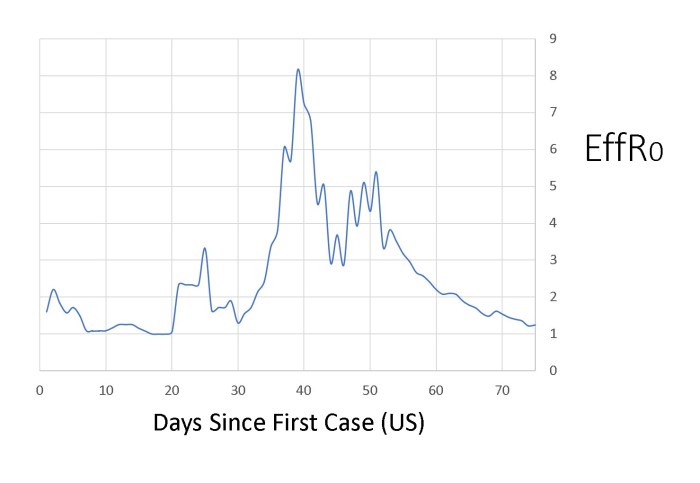
Note we are not yet below 1.0. See how responsive this number is to changes in our behavior? The peak value represents the day POTUS declared COVID-19 a national emergency, and the variation following represents bringing testing online following CDC’s Testing Fiasco. The value of EffR0 peaked at about 5.8, when POTUS declared it to be a national emergency.
These are not number of cases; the total (cumulative) number of cases in the US looks quite different:
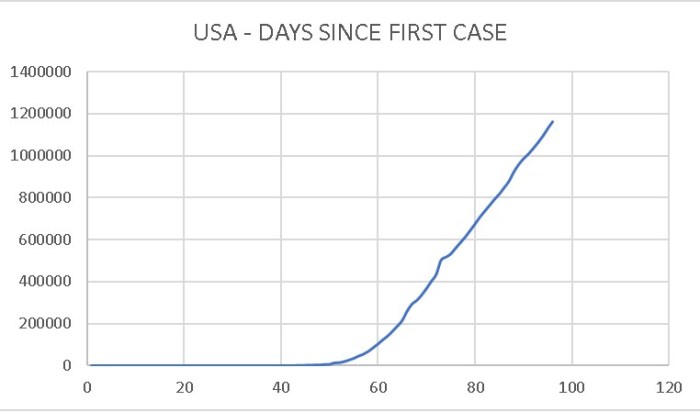
One thing is clear – the virus is not in full retreat by any means – but at least the curve is no longer nonlinear. It’s worth pointing out that R0 > 1 means a constant increase in the number of cases – and therefore the number of deaths. Weeks ago, before the lock-down, the issue was an ongoing increase in the increase of the number of infections. The extent that this is due to social distancing or seasonality remains to be seen – it will take time to know the true and full nature of SARS-CoV-2 and COVID-19.
For a long-view comparison of R0s among pathogens, one can compare overall R0 values of different pathogens over a season or a year (over a fixed time period). It is important to state specifically the time period a given value of R0 is referencing, because it can change from year to year or season to season. It can change due to a mutation, seasonality, or due to a policy change.
(2) Attack Rate
The Attack Rate is the proportion of people who become ill from a disease in a population that was initially free of the disease. Obviously, to be able to answer the question “How Bad Will This Be?”, we have to try to understand how many people can be expected to become infected in total over the course of an epidemic, and over what period of time. If only certain individuals are susceptible to infection, due to behavior or lifestyle choices, the general immediate concern over risk of infection and therefore risk of serious illness or death will be lower. However, if all of the risk is in certain demographics, such as a diseases that only effects newborns, the general concern may be heightened.
Like R0, the Attack Tate is determined by characteristics of a virus and of the host. Initially the attack rate may appear to be high, before a population responds. If the population response is effective, or if they are forewarned, the attack rate can be decreased.
In epidemiology, there are two closely related measures that have significant differences: Incidence and Prevalence.
• Prevalence tells us how widespread a disease is in a population. Prevalence is the ratio of the total number of patients diagnosed at a given time to the total population. (#Infected persons at one time / Size of Population at that time)
• Incidence refers to new cases of the disease in the population in a given time period (such as a year). Incidence is the ratio of total new cases in a population divided by total population size (#Of New Cases During a Period of Time / Median Size of the Population Over that Time Period).
We know the prevalence and the incidence of influenza (or we think we do, see below). While we can know on any given day the prevalence of SARS-CoV-2 infection (estimated, of course), we cannot yet know the incidence for COVID-19 in a manner comparable to influenza annual case rates yet precisely because COVID-19 is new.
For a given timeframe, the total numbers of people diagnosed depends on whether the pathogen has had time – and opportunity – to spread to throughout the population under whatever protocol of public health intervention has been in play. All estimates related to the infection rate (attack rate, incidence, prevalence) of COVID-19 must therefore be interpreted as reflecting the lock-down, social distancing, etc. Since our past annual rates of influenza are from non-lock-down years, we cannot compare COVID-19 population mortality rates and numbers to Influenza in any meaningful way.
(3) Case Fatality Rate (CFR)
The Case Fatality Rate is a measure of the proportion of infected individuals who have died from a disease. It is calculated as
#Deaths Due to Illness From A Pathogen / Number of People Infected
Importantly, CFRs are NOT rate measures, as classically defined, because CFRs do not include a temporal component (time between infection and death due to the pathogen). Imagine a virus that is 100% deadly, but infects people under the age of 5 but only kills them after the age of 60; other causes of mortality such as automobile accidents will reduce the apparent risk of death due to the virus. Case Fatality Rates are, however, considered measures of risk for a specified time period.
People sometimes use the term “Case Fatality Ratio” interchangeable with “Case Fatality Rate“, but this should be avoided but Case Fatality Ratios are actually a measure that compares the Case Fatality Rate between two diseases.
Comparing CFR during an outbreak, epidemic or pandemic for one pathogen to an established, all-season CFR is hazardous. Why?
The problem is that CFR cannot be known in a day-to-day in a manner that is quite as meaningful for understanding the full relative risk of mortality of a disease as we might think. The use of CFR to compare different pathogens has to wait until the end of a outbreak/epidemic/pandemic, or the end of a season. This is true due to the same reason we cannot compare R0 under those conditions – we cannot know the full attack rate until enough time has transpired for the full attack rate to be measured – and in the attempts to compare to other epidemics – until the full effects of a society’s response have materialize.
One could measure “# of deaths per day” and thereby make an attempt to understand a death rate, but since the full Attack Rate is not known the actual full death rate still would not be known until the end of an outbreak, epidemic or pandemic.
And this point is super-relevant for people who want to be able to compare death rates from COVID-19 to influenza: it cannot and should not be done for a few important reasons:
a. We don’t yet know the final Attack Rate of COVID-19
b. We don’t know the long-term (say, annual) CFR of COVID-19
c. There is a vaccine program against influenza, so such a comparison is apples-to-oranges “COVID-19 w/no vaccine vs. Influenza w/a vaccine”.
d. We have more experience treating influenza than COVID-19. The high incidence of mortality from ventilators, for example, in COVID-19 is currently high; those deaths will become unlikely as we change our use of ventilators as standard of care.
It should be understood that the CFR reflects a “risk of dying” IF one is infected. Thus, the CFR is not relevant for the entire population at all unless the Attack Rate is 100%.
(4) Population Mortality Risk
The Population Mortality Risk, or Population Death Rate from a pathogen is ratio of number of deaths from illness from the infection by that pathogen to the total number of people in the population over a specified period of time. The PMR will typically be far lower than the Case Fatality Ratio unless the Attack Rate is 100%.
Modeling
To understand population-wide risk, we have to compare, if we can, the effect of real-life efforts at containment, mitigation, and suppression, ot a null “do nothing model”. Each of any number of plausible scenarios have their own outcome variables, and this goes to a key point of modeling. All models, by definition, are incorrect. They are not reproductions of reality – they are not even attempted reproductions of reality. Therefore even the most granular and correctly arranged model will be incorrect to some degree in detail. In an oubreak, early models will almost always be more incorrect than later models, as more information becomes available. But later models will also have more parameters, as the host species (us), use our innate characteristics (intelligence, behavior, technology, communication, treatments) to change our susceptibility to infection, serious illness and mortality.
Any reasonable response will include factors that influence overall health (nutrition, supplements), access to fresh air and sunshine, understanding who is at most risk, mitigating specific risk, and, most importantly, personal responsibility. Individual actions such as informed self-isolation based on their COVID-19 status from private testing is a variable not yet explored. Instead, testing is considered to be the responsibility of the medical community. In clinical testing, however, the laboratory reports the results of the test to the physician who ordered the test, and to the CDC.
The patient is the last ot know the results, and for meaningful utility leading to rapid change in individual behavior, the patient (or just a person) should be the first to know.
So What Does All of This Mean?
What this means is that CDC has, at the present time, at least 30K deaths it can attribute according to “complex algorithsm” either to COVID-19 or the Infleunza, or both, whatever fits their agenda in June. What people really care about, though is risk to themselves… general population mortality risk due to COVID-19.
If I were to take my best current shot at estimating a population mortality rate, I could do it in one of two ways: using data available before the US societal response, or data available after. Any analysis using total present “today” data on cumulative numbers of cases, or numbers of deaths, in the US would be based on hybrid – not well-defined – set of response parameters. Before the societal lock-down, our response was minimal and impotent. After the lock-down, it’s still very messy because different states have developed different legal paradigms and overarching philosophies on how to respond, and the effectiveness of each paradigm is unknown.
The fact remains: CDC has been combining probable and confirmed cases of COVID-19, and all of our public health policies, and the public’s reactions to those policies, have been a result of using inflated death numbers. Knowledge that the denominator – the total number of cases – is much, much higher than the number of clinical cases means the PMR is VASTLY inflated if one looks only at the Case Fatality Rate. If the real rate of COVID-19 deaths are polluted with deaths from influenza, RSV and other non-COVID-19 pneumonia cases, it impacts population-rate estimates in the moment that makes it impossible to define a rational public health response that everyone can support.
Just as CDC inflated Influenza counts, they are inflating COVID-19 counts. Still, let’s take a look at the overall US “non-lagged” data from Day 80 of the outbreak in the US. The rate of increase in the number of cases and deaths is now constant – approximately linear – so let’s cut to the chase and go right to the number of expected deaths after 365 days if nothing changes.
The number I come up with is 617,902 deaths, giving us a population-wide mortality risk of 0.00185. That’s 185 deaths per 100,000 individuals (population mortality rate).
That’s with Probable Case data – and, very importantly – with the lock-down in place.
Now, with no lock-down, in three months’ time, a power law model tells that we would have 3.3 million deaths; ten days following that, we’d have 8.2 million deaths.
All based on wildly biased estimates published by CDC.
The unbiased data – wherever it is – will now have to be analyzed to produce a lower-bound estimates of these two conditions, but let’s assume for now they will be approximately 1/2 of the size of the biased estimates.
So, lower bound annual population mortality risk, 90 deaths per 100,000, or about 10 in 1,000,000. But no economy.
Neither estimate is realistic. We need to dial into reality.
Of couse the input data from that period of time reflect the effects of CDC’s testing fiasco, reflect no new testing infrastructure, no real general knowledge of the value of self-isolation and sanitation of public spaces, and no widespread use of antivirals to keep viral titres down during infection to prevent serious illness, death and transmission. Yesterday, for the first time, I saw our local grocery chain employees wiping down common surfaces, something I’ve been calling for since early February. These individual factors will matter.
But this is not as simple as “lock-down” vs. “no lock-down”. The two modeled scenarios actually represent extremes on a continuum. A new factor that could be and I think should be added is private, in-home testing. Hundreds of millions of Americans could be tested with a 15-min antibody test in the privacy of their home.
This would be far more effective and less costly than widespread testing w/contact tracing. Further, those who seek medical care would receive a follow-up clinical test – and their data would be available to CDC (standard reporting of age, zip code, gender and COVID-19 status). In-home private testing is the solution to so many problems. It’s rapid, efficient and will prove very effective if the public can be taught how to interpret the test results and be provided simple guidance. (See the IPAKBack2Work Plan). No reporting. No contact tracing. Your employer does not know. Individuals testing and then deciding to do the right thing – including whether they can yet rejoin society. Simple. And this could be done on a regular basis, until allopathy catches up to highly effective curative protocols that do exist.
Our plan preserves HIPAA protections and relies on personal responsibility.
The bulk of the two projections above are, unfortunately, 100% dependent on the CDC’s data reported to WHO. It’s a shame we have to rely on thoroughly corrupted institutions for our data for such an important public health event. WHO by the way, has the US at >67,000 deaths whereas their domestic confirmed data reflects a mere 37,000. Did WHO not get the memo? CDC will gyrate a few times before the settle on one cooked estimate, until June we are told.
Right now, it seems that CDC has a new tactic – to boldly estimate Influenza deaths at two to ten times the rate of past years no longer by combining pneumonia + influenza, but instead perhaps just borrowing from COVID-19 deaths. Perhaps testing is up because of COVID. We’ll see.
Summary
It’s tempting to make comparisons of COVID-19 rates to influenza, but they are fraught with the hazard of being misleading – for methodological reasons and for GIGO (garbage-in-garbage-out) reasons. Elsewhere I have outlined how that comparison is made impossible anyway because CDC has been cooking the books on “Influenza” since 2015 by combining “Pneumonia” deaths with laboratory-confirmed “Influenza” (sometimes referenced by CDC to as “Influenza”, “Influenza Disease” or “P&I” (“Pneumonia & Influenza”), meaning CDC has been misleading the public into perceiving that influenza virus infection is six to ten times more than it truly is (See “Is CDC Borrowing Pneumonia Deaths “From Flu” for “From COVID-19?” April 3, 2020). Some of the pneumonia cases intermixed with Influenza into “Influenza Disease” annually are caused by coronaviruses.
In the 2020 “confirmed cases” report on COVID deaths, CDC notes that for THAT report, “Pneumonia death counts exclude pneumonia deaths involving influenza“
So there is absolutely no justification for the prior years’ combination of Influenza + Pneumonia deaths.
Looking back at data from 2014, only 8.1% of influenza disease deaths were bona fide influenza. When Influenza alone is considered, there are typically less than 5,000 deaths from influenza virus pear year. Of course there is a range of error around that estimate. However, at the most likely rate, nearer to 5,000, influenza causes less than 7.3% of deaths from all causes, and this leads to the stunning reality that influenza should no long be considered an epidemic in the US.
Without integrity and accuracy in assessing rates and risk of serious illness and death due to pathogens, we cannot have evidence-based public health policies founded on science. With practices such as those adopted by CDC, we merely have public health policies founded on dogma, which will always have to eventually be reconciled with reality. COVID-19 has challenged the status quo misleading accounting practices used by the CDC, which, absolutely, must now change.
That’s part of why I am calling for a radically new public health system – one in which the CDC culture is absent, and integrity and accuracy reigns – one with no connection to profit oppotunities. I am calling for a Public Health Integrity Network of 18 performance sites, located within private and public research institutions, each node of which acts completely independent of each other on the same public health problems simultaneously. All results from these activities are sent to an independent body that compiles the range of information presented and best solutions are brought into the public eye. We need pure academic research without perverse financial entanglements and incentives. This network process will replace the CDC. CDC should not be involved in public health matters. Period.
Things will look different when we finally have public health integrity with transparency, accountability and independence from profit motive providing core tenets of professionalism in public health research, and the public will know their privacy and right to autonomy are respected. Which means, of course, no immunity cards, no mandatory testing, and, with respect, no mandatory vaccines.
This article first appeared on jameslyonsweiler.com.


