Ghost Gun Gong Show
“Criminals are taking advantage of this loophole to obtain guns that are later used in crimes.”
In California, perhaps. Elsewhere “ghost guns” are the “assault weapon” for the new millennium… rarely used, marginally worrisome, and perhaps a byproduct of strict gun control laws.
The Summary Data
- Worst case, 1.8% of crime guns are DIY (e.g., “ghost guns”).
- Only 1.3% are DIY crime guns if you remove the top four outlier agencies where DIY guns appear frequently.
- This compares to 7.4% of crime guns that have no visible serial numbers (obliterated + DIY).
- California is the primary state having DIY guns in circulation, averaging 8% of crime guns.
What We Did to Tally DIY Guns used in crime
We sent public records requests to the top 100 police agencies in the United States and asked them to tell us for 2019:
- How many crime guns 1 were confiscated.
- How many of the crime guns had no readable serial number. This included both DIY guns and those where serial numbers had been obliterated.
- How many of the crime guns appeared to be DIY (ghost) guns.
The goal was to see if DIY guns were a significant part of the crime gun inventory. Another study—which we’ll be happy to do once we receive a great big grant from anyone—is to find out if the percentage of DIY crime guns is growing, and if so, if it is growing rapidly. Break out your checkbook and add an extra couple of zeros… this would be a non-trivial exercise.
Before our cutoff date, 33 of the 100 agencies fully complied with our request, four provided incomplete information, and several were simply snotty about the whole thing. Most notably, the Washington, DC police department sent us a canned year-end PDF which had one of the numbers we needed, then dug in their heels about providing real and complete data (it has been appealed to the mayor’s office… and appears to have died there).
Incomplete reports were not included in the analysis since that would screw up everything. But a 33% response rate is robust and enough to get started.
| ⇑⇑⇑ |
UPDATED AS NEW REPORTS ARRIVE The data above will be updated from time to time as more agencies complete their public records requests. |
⇑⇑⇑ |
| ⇓⇓⇓ |
ANALYSIS IS STATIC The analysis below, posted in 2021-04-03, will not be updated as rewriting everything will be of marginal value. So if the numbers below disagree with the numbers above, this is why. |
⇓⇓⇓ |
What We Discovered and the Uncomfortable Perspective
Before we get into the details, an obvious anomaly appeared.
 |
|||||||||||||||
 |
|||||||||||||||
|
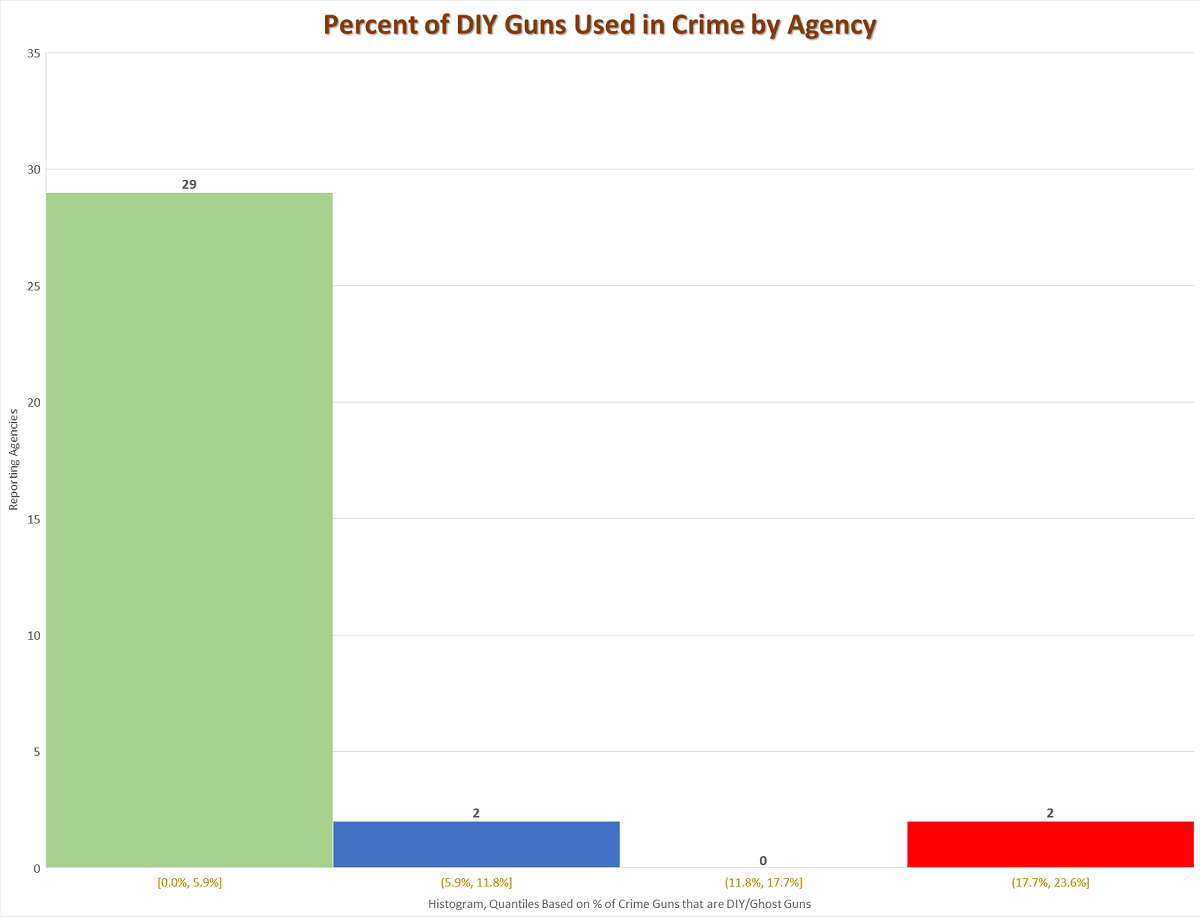
Most agencies (55%) reported no DIY crime guns, or so few that spreadsheet rounding reported them as zero.
Eighty-eight percent of agencies were in the bottom quartile of the percent of crime guns that were DIY guns.
These two data points alone show the “ghost guns” are not a huge problem in terms of crime and criminals, providing we exclude whatever yammering your congress criminal is shouting this week.
What was rather stunning, though, was California [ED: Gun Facts founder Guy Smith was exiled to California for 22 years, and thus has a special interest in their gun laws and outcomes).
Whereas DIY guns constitute 1% of crime guns in non-outlier cities, they are 8% in California cities and practically a cottage industry in both San Francisco and Bakersfield (culturally speaking, two very different towns). There is a minor issue therein, given the relatively low number of recovered crime guns (Los Angeles recovered 12 times as many crime guns… though with only 4.5 times as many people).
But Cali takes the top four spots, and 73% of the top 11 spots. In short, if there is any such thing as a “ghost gun” problem, it is in the state where the Brady Campaign and the Giffords Law Center rank as having the ”strongest” gun law in the country.
We won’t speculate if there is a cause-and-effect situation here. But do incorporate this into your speculations: California passed laws that created an ever-dwindling list of “safe” handguns (the gun of choice for criminals). As the retail market becomes tighter and prices skyrocket, the underground supply of guns may be drying up as thugs realize they can get an ever-escalating resell price for “pre-roster” guns and are putting them back into legal exchange. With an ever-tighter supply of black market guns, some enterprising criminals may be making guns for their fellow felons.
Let’s make one more contrast to put California (currently headed by Gavin Newsom) and San Francisco (#2 on the DIY gun list and formerly headed by… Gavin Newsom) into perspective. Excluding outlier agencies (like Bakersfield down to Stockton), the abbreviated number of crime guns that were DIY was 1.3%. All reporting California cities came in at 8%, with San Francisco at 20.7%.
Problems with Reporting
Records are not what we might hope for.
We had to filter out more than a few responses that provided data on all three points (total crime guns, no serial number guns, DIY guns) but had other defects. The most common problem was that some agencies did not segregate crime guns from all confiscated guns. For amenable agencies, we paid their clerks to perform a hand count of the records. For agencies that were not amenable, we did not use their reports.
Likewise, there were a couple of agencies where antique guns that came into the world before serial numbers were mandatory were in the “no serial number” pile. Thankfully these were nearly zero, and even if we had not caught and cleaned the data, it would not have made a huge difference.
Several agencies are positively archaic in their public records access, requiring sending in request via snail mail (not even via fax). We skipped those. Note to Detroit and Oklahoma City: it is the twenty-first century; get with the program.
Likewise, some agencies used any excuse they could to not report the data. The most common excuse was “You don’t live in this state, so we don’t have to help you.” Even offering to pay them to do the work was rejected. Chesapeake, VA, Memphis, TN and Pittsburgh, PA were abruptly uncooperative (so if any locals want to file a request for us, send us an email).
The biggest problem was that some agencies simply don’t track this stuff, or at least in a way that was easy to get to. Austin, TX merged crime guns and stollen guns and could not separate them. Atlanta, GA does not track guns without serial numbers. Henderson, NV, Reno, NV and St. Louis, MO simply don’t track any of it.
Several agencies are promising to send the data, but due to various reasons (typically COVID-related), some of that data won’t arrive until later in the year.
 But the prize for being openly onery goes to… Washington, DC (not surprising). They lackadaisically sent a PDF titled “State-of-the-art Science, Safer Streets.” Someone should alert the citizens of DC about their safer streets because according to the FBI, the place is still the most deadly in the nation.
DC would not tell me how many crime guns they confiscated, but their PDF mentioned that they had examined 4,257 guns that were subject to “shooting-related investigations.” Los Angeles, with a much larger population than Washington, DC, had collected 4,988 crime guns in the same year that DC collected 4,257 shooting-related guns. In other words, DC has even more guns confiscated from robberies, aggravated assaults, menacing discharges, and so on. They obviously would top all of the charts, which might explain why they are sooooooo reluctant to reveal information.
But buried on that same page was an admission that (a) they had collected 84 “ghost guns” and that was a 366 percent increase” from the year before. Worst case scenario (via the undercounting of all crime guns) DC has a 2% DIY crime gun rate, which puts it in the lowest quartile. I guess you cannot score political points if you are just average, so they make their DIY gun “problem” sound worse than it is.
Gone Like a Ghost (gun)
The rhetoric about DIY guns is pretty obvious. Humans rightly fear the unknown, and guns without a trackable pedigree are a concern. Excluding the outlier cities, 7.4% of crime guns have no visible serial number, but only 1.3% were ever DIY guns. That is tiny.
How tiny? Even including the outlier cities, there were 870 DIY guns recovered. According to the ATF, about 40,000 guns were stolen from FFLs and upwards of 360,000 are stolen each year. That means DIY guns used in crime are about 0.2% the number of stolen guns.
But don’t expect anyone with an agenda to recognize this reality, because addressing things like theft, inner-city gang violence, and other serious gun crimes is not something they want to tackle. That would require honesty and real work.
Notes:
- Defined as a gun used in the commission of a crime. This specifically excluded “red flag” confiscations, voluntary turn-ins, found guns, guns taken from criminals but not used in their crime, etc. ↩
This article first appeared on Gun Facts. Please make a donation directly to them at https://www.gunfacts.info/donate/


