Pediatric Agitprop
After reading a recent study published in Pediatrics, I would caution parents about allowing a member pediatrician to treat their child. Looks risky.
That may be an unfair jab, but once again we see doctors – too often funded by activist groups – doing criminology research and producing deformed analytical offspring. Worse yet, many in the media picked up on the inaccurate conclusions to pen woefully inaccurate headlines:
ABC: Child gun deaths lower in states with stricter gun laws
TIME: Fewer American Kids Die in States With Tougher Gun Laws
U.S. News: Tough State Gun Laws Help Keep Kids Safe
CNN: Children in states with strict gun laws are less likely to die
None of which was (a) what the study said and (b) any reflection of reality outside the alleged minds of news editors.
The study, such as it is
I won’t waste too much time reviewing the layered defects of the study titled State Gun Laws and Pediatric Firearm-Related Mortality. Click the link if you are a punishment glutton. The summary is that, on a scale of 1–10 concerning research quality, where one is the worst of the worst, this study might actually achieve a negative score.
My snarkiness aside, the study’s two glaring defects are:
- It uses a measure of gun control strictness that everyone agrees is completely arbitrary.
- In includes children up to age 21, including your garden variety street gang member.
These are not trivial issues, so let’s expose them sufficiently so that even an editor at Pediatrics can wrap their minds around the trauma this study causes reporters at ABC, Time, CNN and other outlets.
The Brady Scorecard
The study used a scorecard once created by the now moribund Brady Campaign to rank the strictness of state gun laws. Were the Gun Facts project the only analysts to have derided the Brady Scorecard (as we did here), you might find this a nit well picked. But just about everyone with functioning dendrites has noted that the points awarded each form of gun control listed in the Brady Scorecard was arbitrary. The Brady Campaign never published their rhyme or reason for the scores they used, and thus the list appears to be merely which laws Brady’s liked best (or wanted enacted the most).
This issue is critical. The scorecard was the denominator. This was the fundamental measure within the State Gun Laws and Pediatric Firearm-Related Mortality study. If the data behind a fundamental metric is bunk, then the entire study is as well. We could stop here, but the study’s overt mendacity led us to some extended digging (more on that below).
Gang bangers, not baby buggy bumpers
People who study gangs report that the prime recruitment age for new gang members is between 13 and 18 years old. We won’t bother to detail why this is a ripe span for minting new thugs, but we cannot avoid noting that it is well within the age range of the study. In other words, the authors of State Gun Laws and Pediatric Firearm-Related Mortality included firearm deaths of every gangsta wannabe from age 13 through age 21. In their study they made no obvious allowance for this by weighting for urbanicity and the more relevant urban+poverty intersection.
This too is a critical bit. We know from decades of criminology that the firearm death rate is low in rural areas, and high in urban ones. Low in middle- and upper-income brackets, high in poorer brackets. Low where gang participation rates are low, high where it is high. By not controlling for this reality, the study’s authors committed criminology malpractice.
Digging into the reality
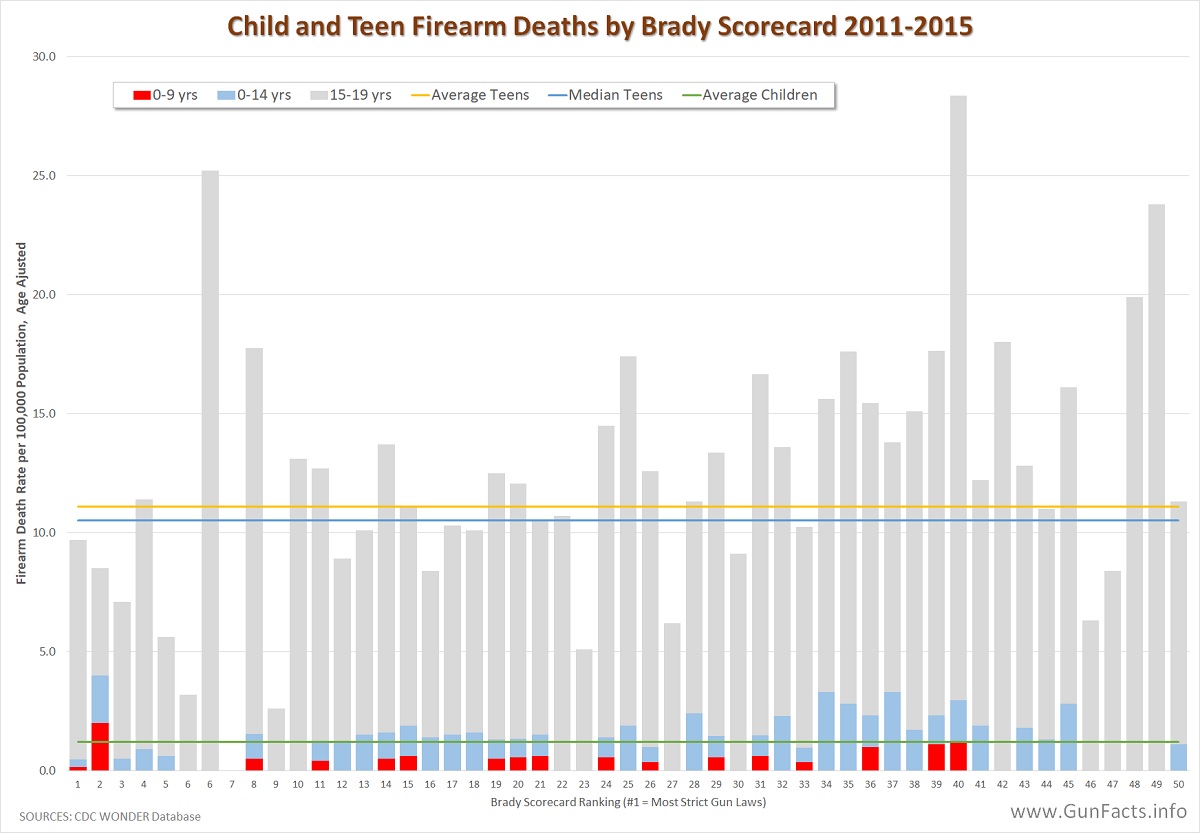 We used the same core mortality data that the authors of the study did, pulling from the CDC’s WONDER database. We included but stopped at age 19 because this allows a clear delineation between children (slightly inaccurately framed as ages 0–14) and teenagers (in this case ages 15–19). This is the default breakpoint in the CDC WONDER database.
What we see is confirming and confounding. Two quick notes are necessary for a complete understanding.
First, the Brady Scorecard omits Washington D.C., a gang-infested place that has from time to time been the murder capital of the nation. It has been claimed that Brady omitted D.C. on purpose since it made their claims about the efficacy of gun control appear wrong. I suspect this assertion is true, but it presented us a problem – where in the spectrum of “gun law strictness” should D.C. Be placed? In the wake of the 2008 Heller decision and a series of lawsuits D.C. lost defending its draconian gun control laws (handguns were outright banned), we had to be a little arbitrary ourselves and eyeballed a position after scanning the Brady Scorecard’s 38 laws. After all, the Pediatric’s cited study’s period was from 2011 through 2015 (as is our review) and things were a-changin’ in the District during those years.
You will notice in the strict end of the range there is a missing column. That is for Hawaii, which has its own quirks concerning guns (the rate of residential mobility between Hawaii and other states is very low, so they do not contend with many gun-related phenomena). But their gun laws are stiff and not far afield from D.C.’s in general, so we opted to stack D.C. next to Hawaii (and for the review, the precise position does not require “three-nines” accuracy).
This decision doesn’t matter much, though. It is the left end of the chart that the authors of State Gun Laws and Pediatric Firearm-Related Mortality contend are effective in lowering child firearm death rates. What we see is that there is little truth to the claim. For you number nuts, the R2 regressions for both children and teens firearm death rates were 0.21 and 0.16, respectively, against the Brady Scorecard rankings. Take the oddball Hawaii out of the list and the regressions improve slightly to 0.21 and 0.24 – still largely unconvincing (for readers unacquainted with regressions, a score of zero means there is no correlation between state gun law strictness and firearm deaths, and a score of one would mean perfect correlation).
It is important to observe the red and blue parts of the columns. These are the true “children.” Red are kids up to age nine, and blue goes up to indisputable adolescence. Notice how comparatively low they are to teenagers, some of that latter group running in street gangs. This is where the story starts to get interesting.
Homicides, suicides and accidents
The three top modes of death by bullet are homicides, suicides and accidents (though not in that order). We asked the CDC database about these mode of death vis-à-vis children and found that what is already known is again confirmed.
First, we didn’t bother to chart accidental firearm deaths. Those have been falling faster than pants at a Jeffrey Epstein pool party and doing so for decades. The CDC reported that a mere 25% of states saw any accidental firearm deaths of people under age 20 from 2011 through 2015. And those states report numbers so low that they are statistically fragile.
Suicides are also a bit suspect. Child suicide rates are, for practical purposes, zero. Teenage suicide rates are half the rate of middle-aged people, though slightly closer for firearm suicides. All in all, though, not an urgent policy point.
That leaves homicides, which brings up the rather uncomfortable question of “Who would want to shoot a child or teenager?” This fundamental query circles back to proposition posed in State Gun Laws and Pediatric Firearm-Related Mortality: would the relative “strictness” of state gun laws make a difference?
 The answer to the latter question is “no,” at least for teenagers.
There is profoundly weak correlation between the arbitrary Brady Scorecard rankings for state gun law strictness and firearm homicides (R2 of 0.015 for children and 0.002 for teens). Indeed, as the trendline suggests, for teens there is a slight lowering of the risk of being shot dead as gun laws become less strict, though we have to accept this trend is influenced by a few states with sparse populations and certain cultural values (those states being Utah, Kentucky, Kansas, Mississippi, Alaska, and Arizona).
The big takeaways
We should not labor over this any longer. The Brady Scorecard is arbitrary, and using it for any serious investigation is nonsense. But even if we accept that perhaps it is a rough measure of how “strict” a state’s gun laws are, the inclusive data (e.g., including D.C.) does not support the conclusion the study claims, at least via unmassaged numbers. The question (already answered by criminologists) then remains, as it always has, why nearly four times as many teens are shot dead in metropolitan areas than elsewhere. We know the answer, and have for decades, but people need to be educated about this reality at the Children’s National Health System, George Washington University, and the publication called Pediatrics.
This article first appeared on Gun Facts. Please make a donation directly to them at https://www.gunfacts.info/donate/


